 POWER SYSTEMS |
 |
|||||
| BLOG
EEE
EEE
NEXT > Global Electricity Review 2026 Polyphase Wireless Power Transfer Systems An Introduction to Battery Energy Storage Systems and Their Power System Support Electric Transmission and the Energy Transition: Perspectives from Africa, Europe, and North America Developing Transmission to Support West Coast Clean Energy Resources AI in Power Systems symposium Power Europe: Summer Outlook 2024 VOD
EEEEEE
NEXT >
Showing 1 to 7 from 168 blogs In order to extend the content of this website, we invite you to contribute any information, including news, events, books, blog posts, universities, links, etc., you find helpful about power system engineering.
POWER SYSTEMS |
clearpower - 2021 Report: Clean Energy Powers America In 2021, the U.S. clean power industry hit significant milestones, but current growth must accelerate to reach net zero grid by 2035. AMERICAN CLEAN POWER - 2021 Annual Market Report 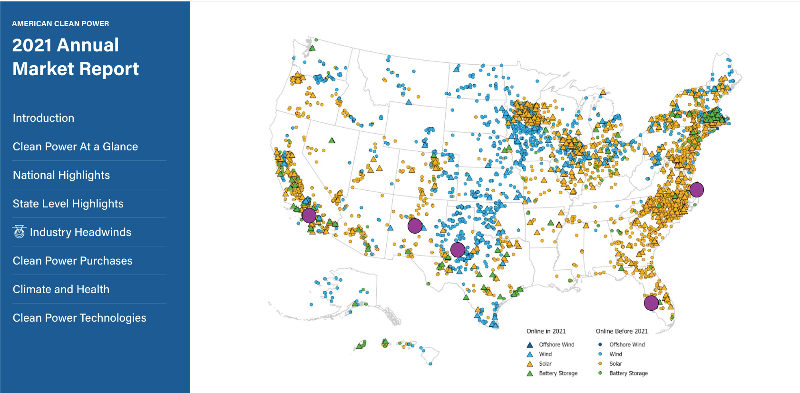 < <2021 marked a record year for clean power. Our industry reached a major milestone by surpassing 200 GW of renewable energy capacity. But despite this laudable progress, 2021`s pace of clean energy deployment must accelerate at a more rapid rate to meet America`s climate and emissions goals. While 2021 installations of solar and storage soared and costs remained low, bottlenecks in transmission and policy uncertainty threaten to stall future development. Understand the progress and challenges of American clean energy in 2021 by interacting below with data collected for ACP`s new Clean Power Annual Market Report 2021. Clean Power at a Glance In 2021, wind, utility solar, and battery storage power capacity in the U.S. topped 200 gigawatts (GW) after 28.5 GW of clean energy projects came online in 2021. 28.5 GW is enough to power more than 6.6 million homes or 500 million LED lightbulbs. The U.S. has come a long way since reaching the milestone of 2 GW of clean power installed two decades ago. The rate of installs has increased rapidly over time, allowing the country to reach new clean power milestones more regularly. Over the past 5 years, the nation has added 100 GW, doubling the existing capacity from 2016. Despite being the second largest year on record, the pace of installations in 2021 fell short of what is required to achieve a net zero emissions goal. If the industry only built 28 GW annually for the next 14 years, the U.S. would only have 35% of the clean power resources required for an emission-free power sector. Since 2001, clean power has gone from producing less than half a percent of total U.S. electricity generation to producing 13% of total electricity in 2021. The growth rate has increased significantly over time. During the first five years of the decade, clean power generation share increased by only 0.5% a year. Over the past five years, the share has increased by 1.2% annually on average. Clean energy is powering states across the country. Five states have a clean energy generation share of electricity above 30%, and 25 states in the U.S generate at least 10% of their electricity from wind and solar. Iowa leads the nation at 56% clean energy generation, followed by South Dakota at 52% – up from 33% just one year ago. For the third year in a row, onshore wind led capacity additions, capturing 38% of the market. Utility solar was a close second, representing 35% of new additions. Battery storage captured 8% of the market, leaving clean power resources with 81% of 2021 installations. Top States for Clean Power Additions Texas led the country in clean power installations in 2021, installing 7,690 MW. California came in second with 2,852 MW installed, followed by Oklahoma with 1,408 MW and Florida with 1,382 MW. In total, seven states installed more than 1 GW of new clean power capacity in 2021. Texas was the top installer of the year for both wind (3,343 MW) and solar (3,768 MW) and came in second behind California for storage additions (579 MW). California installed 1,371 MW of new storage capacity in 2021. In 2021, Texas installed enough clean energy to fully power Delaware and Hawaii combined. Transmission Not enough transmission is being built to support the energy transition. In 2021, utilities and transmission developers only add 386 miles of new transmission to the country’s grid. That’s way down from an average of 1,800 miles per year over the last decade. And only 5,000 miles is on-track for delivery between now and 2025. Transmission is critical to maintain a reliable electricity grid and to more efficiently and effectively integrate renewable energy resources. Recent transmission additions are not adequate to enable the clean energy transition. Interconnection queues While wind, solar, and battery storage projects make up the vast majority of projects in interconnection queues, delays in the interconnection process slow clean power development. Hybrid projects have become increasingly prominent in the interconnection queue, making up 32% of all capacity in the queues across the U.S., while standalone solar projects represent roughly 28%. Solar combined with battery storage are the most popular, accounting for 90% of hybrid projects in the queues. In particular, CAISO and non-ISO West ques are dominated by hybrid solar plus battery storage projects. This is most likely driven by the fact that both regions already have a high solar penetration rate and developers are seeking to shift electricity generated by solar to other periods of the day. Solar makes up the majority of the queue in MISO and a plurality in PJM and ERCOT, while wind makes up the majority of the queue in NYISO and NE-ISO, primarily due to offshore wind projects. The dominance of clean power technologies in interconnection queues is a promising indicator of future power developments, but the process needs work to meeting growing demand for renewables. Cost of Clean Power While the rate of cost reduction slowed for wind and solar in 2021 due to increasing capital costs, wind and solar remain the lowest cost new power sources. As generation technologies that do not rely on fuel to produce electricity, technological advances that lead to falling turbine and solar module costs translate quickly to reductions in the Levelized Cost of Energy (LCOE). LCOE is the lifetime price level that developers & owners of renewable energy projects need to secure to cover project and operational costs and receive a reasonable profit margin for their work bringing the project to market. The LCOE of wind turbines has dropped 47% since 2012, while solar’s LCOE has declined 71% due to improved efficiencies and technological advances. Offshore wind has similar advancements, with LCOE decreasing by 45% since 2013. Nonetheless, power purchase agreement prices are on the rise. According to findings from a LevelTen survey, PPA price volatility (PPA prices have increased in 2021) is being fueled by long grid connection timelines, high costs of grid updates, supply chain challenges, and product availability. Looking ahead Looking into 2022 and beyond, inflation, supply chain issues, and the uncertainty of tax policy and lack of predictable regulatory action for renewable energy are all expected to have a concerning impact on our ability to deliver growth. Further, continued and arguably heightened uncertainty brought about by challenges to existing trade precedent – like this year’s Department of Commerce inquiry into solar module tariffs – are already taking a toll. Previously expected to experience robust growth, utility solar now faces modules shortages and trade risks that are delaying projects or even causing them to be canceled. At a time when every MW of clean energy is crucial to protect Americans’ pocketbooks, drive economic growth, and achieve the country’s climate targets, these unnecessary barriers are slowing progress. Clean Power Purchases For the first time, corporate buyers and non-utility purchasers announced more new clean power purchase agreements than all utilities combined. With almost 13 GW of power purchase agreements, corporate buyers also help set a new annual power purchase agreement record in 2021. Clean Power Technologies Scalable clean power technologies, like wind, solar, and battery storage, have continued to improve in their efficiency and drop in cost, leading to deployment across the 50 states. 2021 was the largest year on record for battery storage installations. In 2021, 2,695 MW and 7,774 MWh of battery storage capacity came online. This is a 200% or 331% increase from 2020 installations. About two-thirds of the battery storage projects installed in 2021 were part of hybrid projects. Cumulative online battery storage capacity is now over 4,700 MW and 11,300 MWh. For scale, 69% of total capacity online and 69% of total energy capacity online was installed over the past year. As the cost of energy storage has continued to decrease, hybrid projects, which pair together wind, solar, or storage, have become more common. In 2021, 3,364 MW of new hybrid capacity came online. Almost all of that capacity came from solar + storage projects. In total, there is over 10.9 GW of hybrid project capacity online in the U.S.. Over the past two decades wind turbines have increased their rotor diameters and hub heights, which has in turn increased nameplate capacities. The average hub height of turbines installed in 2021 reached 91 meters and the average rotor diameter spanned 125 meters. The average wind turbine size increased in 2021 to 2.9 MW, up from 2.7 MW last year. The 13,400 MW installed in 2021 brought the U.S. to 135,843 MW of cumulative operating capacity. Many of these wind projects are concentrated in the central plains of the U.S. where world-class wind resources are located. Cumulative operating wind power capacity stood at 135,843 MW as of the end of the year. Offshore Wind Power U.S. offshore wind accelerated forward in 2021, as the first two domestic offshore wind turbines located in federal waters completed construction and started delivering electricity to the grid. Solar Power In 2021, solar power developers brought online 424 utility scale solar projects totaling 12.3 GW. These projects were spread across 36 states, including six states that added 500 MW or more. Texas led all states in new solar power, installing nearly 3.8 GW. California followed with nearly 1.2 GW and Florida placed third, adding just below 1 GW. |